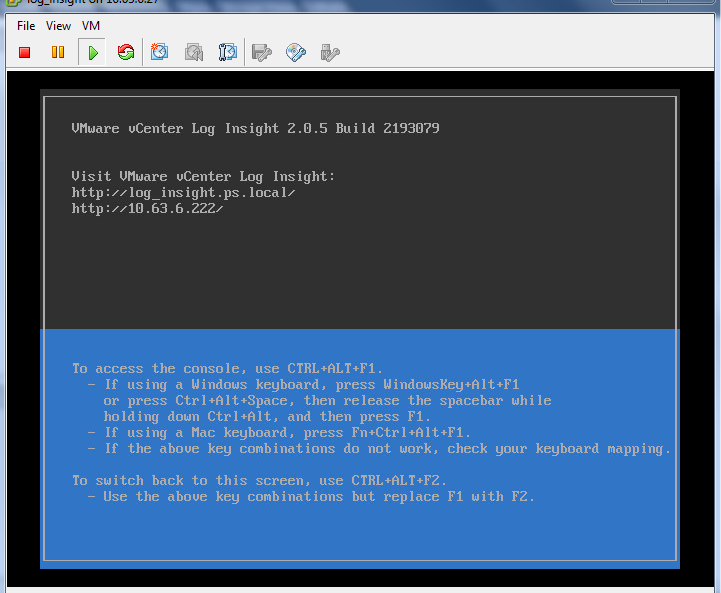
vCenter Log Insight
or now known as "vRealize Log Insight" is a real-time log management
solution for Vmware environment. It has "machine learning -based
intelligence grouping" which will group the related data together,
consolidates information and shows in customizable graphs. It is also a Syslog
Server which can consolidate logs and analyze it.
Log Insight includes
a built-in syslog server, it can analyze log events from any source which can
forward syslog feeds. So you may configure ESXi, vCenter or any Cloud Suite
product to forward log events to Log Insight.
Integration Options:
Currently it
integrates with multiple vCenter Servers and vCenter Operations Managers.
Log Insight can
collect two types of data from vCenter Server instances and the ESXi
hosts that they manage.
* Events, tasks, and alerts are structured data with specific meaning. If configured, Log Insight pulls events, tasks, and alerts from the registered vCenter Server instances.
* Logs contain unstructured data that can be analyzed in Log Insight. ESXi hosts or vCenter Server Appliance instances can push their logs to Log Insight through syslog
Deployment
Configuration:
Small - upto 100
ESXi servers
Medium - upto 250
ESXi Server
Large - up to 750
ESXi server
1 . Connect to vCenter Server, click on File and select deploy from OVF Template and locate the log Insight ova file and select next.
2. Accept the License and give the name for Log Insight Appliance. Select the appropriate Cluster, Host and Datastore.
3. Select the appropriate deployment Configuration and complete the wizard to start the deployment.
After successful
deployment start with the configuration.
- Open browser and enter http://fdqn/ip_of_log_insight.
- Click on next to the start the configuration.
- As this is the first time setup, we would select the "Start New Deployment" option.
- Admin Credentials: Enter the admin email and set the password and click on "save and continue".
- Enter the License Key and click on continue.
- General Configuration: Enter email address to send System Notification.
- Time Configuration: Enter your NTP server details and click on test to confirm. Or you may sync time with ESXi Host.
- SMTP Configuration: Update the correct SMTP details. You may confirm the configuration with "Sent Test Email".
- This concludes the
configuration, go ahead and click on Done.
Integrations:
vCenter Server:
Next it will
automatically takes you to the Dashboard, as this is first time setup, we need
to do the vSphere Integration. Click on the vSphere Integration hyperlink.
You may integrate
multiple vCenter Servers and vCenter Operations Managers.
- Enter the vCenter Server details and Click on Test.
- After successful Test, click on Save.
vCenter Operations
Manager:
- Click on the vCenter Operations Manager tab under Integration.
- Enter the vCOPS details, remember the username is "admin" not root. After successful Test, click on save.
vCenter Log Insight
Interface:
There are 2 default
Tabs: Dashboard and Interactive Analytics. The Dashboard shows your complete
environment's events, faults etc graphically and has inventory of all objects
at left which can show relevant information.
The Interactive
Analytics shows the real time log
analysis, where you can search with query words and set the time duration
starting from last 5 minutes to All Time. Once you get handy with this
analytics, the root cause analysis becomes very easy.
I hope this post was
informative.


No comments:
Post a Comment